
Below is statistical data on donations to Non-Profit Organizations in the United States in 2023.
Estatísticas de caridade
- 31% dos doadores em todo o mundo doam a ONG, organizações sem fins lucrativos e instituições de caridade localizadas fora do seu país de residência.
- 41% donate in response to natural disasters.
- A doação de educação registou um crescimento relativamente mais lento (3,6 por cento) em comparação com as fortes taxas de crescimento registadas na maioria dos anos pós-recessão. Em cada um dos anos de 2014 e 2015, a doação à educação cresceu mais de 8 por cento.
- Donations to international affairs, human services, and public society benefit organizations grew. This growth occurs despite relatively few well-publicized natural disasters, which often increase contributions to these types of organizations.
- Instituições de caridade ambientais e animais; organizações de artes, cultura e humanidades; organizações sem fins lucrativos de assuntos internacionais; e as causas de saúde registaram os maiores saltos nas contribuições.
- O total de doações de caridade cresceu 4,1% em 2016 e 5% em 2017.
- As doações da fundação em 2016 aumentaram para US$ 58,28 bilhões – um aumento de 3,5% em relação a 2015.
- As doações para instituições de caridade para a educação aumentaram 6,2%, para US$ 58,9 bilhões (14% de todas as doações).
- As doações para instituições de caridade de serviços humanos aumentaram 5,1%, para US$ 50,06 bilhões (12% de todas as doações).
- Foundations saw an increase of % to $45.89 billion (11% of all donations).
- As instituições de caridade de saúde registaram um aumento de 15,5%, para 38,27 mil milhões de dólares (9% de todas as doações).
- As instituições de caridade de benefício da sociedade pública registaram um aumento de 7,8%, para 29,59 mil milhões de dólares (7% de todas as doações).
- As doações para instituições de caridade internacionais diminuíram 4,4%, para US$ 22,97 bilhões (6% de todas as doações).
- Arts, Culture and Humanities saw an increase of 8.7%, to $19.51 billion (5% of all donations).
- As instituições de caridade que se concentram no Meio Ambiente/Animais tiveram um aumento de 7,2%, para US$ 11,83 bilhões (3% de todas as doações).
- Historicamente, os grupos religiosos receberam a maior parte das doações de caridade. Isto continuou a ser verdade em 2016. Com o aumento de 2,9% nas doações este ano, 31% de todas as doações, ou 127,37 mil milhões de dólares, foram para organizações religiosas. Muitas dessas contribuições podem ser atribuídas a pessoas que doam ao seu local de culto local.
- Em 2017, a maior fonte de doações de caridade veio de indivíduos, com US$ 281,86 bilhões, ou 72% do total de doações; seguidas por fundações (US$ 58,28 bilhões/15%), legados (US$ 30,36 bilhões/8%) e corporações (US$ 18,55 bilhões/5%).
- Em 2016, a maior parte dos dólares de caridade foi para religião (32%), educação (16%), serviços humanos (12%), fundações doadoras (11%) e saúde (9%).
- Environmental and animal protection organizations experienced the largest increase in donations in 2016, receiving 7.2% more than the previous year.
- As doações de caridade representaram 2,1% do produto interno bruto em 2016.
- Historicamente, as doações de caridade aumentam cerca de um terço mais rápido que o mercado de ações.
- Aproximadamente 91% das famílias com alto patrimônio líquido doam para instituições de caridade.
- Em média, os doadores com elevado património líquido doaram 25.509 dólares para instituições de caridade em 2015. Em comparação, os agregados familiares da população em geral doaram em média 2.520 dólares.
School Fundraising Statistics

- 56% of the country's public schools have at least one appeal to donors on their website.
- School groups raise more than US$ 1.5 billion every year by selling various products.
- Fundraising for traditional products represents about 80% of the dollars school groups use to provide “extras” to their schools.
- 67% of directors defer fundraising decisions to their PTO or PTA, although experts believe this hands-off approach actually harms the
successful fundraising. - 71%'s parents said they sold fundraising products to friends, family and co-workers.
- Schools' 35% earn on average between US$ 0 and US$ 5,000 in annual earnings from fundraising, while 27.1% earn more than US$ 75,000.
- As contribuições de caridade para faculdades e universidades nos Estados Unidos aumentaram apenas 1,7% em
2016. - US$41 billion was raised for colleges and universities in 2016, up from US$40.30 billion raised in 2015.
- The top 20 fundraising institutions together raised US$ 11.12 billion, 27.1% of the 2016 total.
Doações de caridade para igrejas
As doações à religião (definidas como doações específicas a congregações, denominações, sociedades missionárias e meios de comunicação religiosos) têm permanecido consistentemente como o maior beneficiário de doações de caridade na América.

- 49% of all church donation transactions are made by card.
- 8/10 people who donate to churches have no credit debt.
- 60% are willing to give digitally to their churches.
- Tithers represent only 10-25 percent of a normal congregation.
- Churches that accept online tithing increase overall giving by 32%.
- Only 5% tithe and 80% of Americans give just 2% of their income.
- Christians are donating 2.5% of income; during the Great Depression it was 3.3%.
- Only 3-5% of Americans who give to their local church do so through regular tithing.
- When surveyed, 17% of Americans say they tithe regularly.
- For families earning more than US$ 75 thousand, 1% of them donated at least 10% in tithing.
- 3 out of 4 people who don't go to church donate to non-profit organizations.
- The average donation made by adults attending Protestant churches in the US is about US$$17 per week.
- 37% of regular churchgoers and evangelicals do not give money to the church.
- 17% of American families have reduced the amount they give to their local church.
- 7% of churchgoers decreased regular giving by 20% or more.
- About 10 million tithe payers in the US donate US$ 50 billion annually to churches and non-profit organizations.
- 77% of those who tithe give 11% to 20% or more of their income, much more than the baseline of 10%.
- 7 out of 10 tithe payers do so based on their gross income and not their net income.
Demografia de doações de caridade
Qual faixa etária doa mais para instituições de caridade?
Y generation

- that's 25.9% of the US population.
- 40% dos doadores Millennials estão inscritos em um programa de doações mensais.
- 26% gave tribute gifts.
- 46% donate to crowdfunding campaigns.
- 15% donated at #GivingTuesday 2017.
- 16% donate through Facebook fundraising tools.
- 64% volunteers locally and 9% internationally.
- 55% participate in fundraising events.
- 11% of total donations in the US comes from Millennials
- 84% dos Millennials doam para instituições de caridade, doando uma média anual de US$ 481 para 3,3 organizações.
- Millennials are active on their phones and are more responsive to text messages and social media, but they rarely check personal emails or respond to voice calls.
- Millennials are more likely to contribute to work-sponsored initiatives, give via mobile devices and watch online videos before making a gift.
- 47% of Millennials donated through an organization's website in 2016.
Generation X

- that's 20.4% of the US population.
- 49% dos doadores da Geração X estão inscritos num programa de doações mensais.
- 31% give tribute gifts.
- 45% donate to crowdfunding campaigns.
- 14% donated at #GivingTuesday 2017.
- 19% donate through Facebook fundraising tools.
- 64% volunteers locally and 8% internationally.
- 56% participate in fundraising events.
- Gen Xers are more likely to fundraise for a cause, make a pledge, and donate their time to an organization.
- Gen X prefers texting or voice calling. These donors regularly check their email and stay updated on their social media feeds.
- The email generated 31% of online donations made by Gen Xers
- 59% da Geração Z são inspirados a doar para instituições de caridade por meio de uma mensagem/imagem que viram nas redes sociais.
Baby Boomers

- represent 23.6% of the US population.
- 49% dos doadores Baby Boomer estão inscritos em um programa de doações mensais.
- 41% give tribute gifts.
- 35% donate to crowdfunding campaigns.
- 15% donated at #GivingTuesday 2017.
- 21% donate through Facebook fundraising tools.
- 71% volunteers locally and 9% internationally.
- 58% participate in fundraising events.
- 24% dos Boomers dizem que foram promovidos para fazer uma doação online por causa da mala direta que receberam.
- 72% dos Boomers doam para instituições de caridade, doando uma média anual de US$ 1.212 para 4,5 organizações.
- Boomers answer voice calls, check emails regularly, and also use text messaging and social media. Although initially slow to adopt new technologies, they adopt them quickly once they do.
- Boomers are more likely to make recurring donations on a monthly, quarterly or annual basis.
Greatest Generation
- is 11.8% of the US population.
- 30% of donors over 75 say they have donated online in the last 12 months and, on average, donate 25% more frequently than younger generations.
- 88% da maior geração doa para instituições de caridade, doando uma média anual de US$ 1.367 para 6,2 organizações.
- They represent 26% of total US donations
- Most prefer voice calls and direct mail. These donors are late adopters of email and typically do not use text messaging or social media.
- Older adults are more likely to donate through direct mail campaigns and physical goods.
Estatísticas e tendências de voluntariado
- Approximately 63 million Americans — 25% of the adult population — donate their time, talents, and energy to make a difference.
- O valor nacional do tempo de voluntariado em 2016 é de US$ 24,14 por hora. Por outras palavras, os americanos contribuem com 193 mil milhões de dólares do seu tempo para as nossas comunidades.
- A taxa de voluntariado diminuiu 0,4% para 24,9% em 2016.
- Women volunteer at higher rates (27.8%) than men (21.8%).
- People between 35 and 44 years old and between 45 and 54 years old are most likely to volunteer (28.9% and 28%, respectively), while people between 20 and 24 years old have the lowest rates (18 ,4%).
- On average, people spend an average of 52 hours a year volunteering their time.
- 72% of volunteers are involved with just one organization, while 18.3% are involved with two.
- The top four national volunteer activities are collecting or distributing food (24.2%), fundraising or selling items to raise money (23.9%), general labor or transportation (18.8%), and tutoring or teaching (17. 9%).
- As quatro principais áreas de voluntariado são para organizações religiosas (34,1%), educacionais (26%), serviço social (14,9%) e saúde (7,3%).
- 42.1% of people became volunteers at their primary organization after being asked to volunteer.
Estatísticas gerais de doações de caridade
- 30% of annual giving occurs in December.
- 10% of annual donations occur in the last 3 days of the year.
- 77% believes that everyone can make a difference by supporting causes.
- 4,5 é o número médio de instituições de caridade que cada pessoa apoia.
- 64% of donations are made by women.
- 69% of the population donates.
Corporate Giving Statistics
Corporate giving in 2021 increased to US$20.77 billion – an increase of 8.0% from 2019.
Corporate Giving Trends and Developments
- 39% of the companies surveyed indicated plans to expand their workplace giving programs over the next two years.
- More than 49% of nonprofit respondents identified workplace giving as a growth strategy for their organization.
- Over the past three years, the percentage of Russell 1000 companies offering corporate gifts has grown by 11.8%.
- 97% of donors want flexibility about where and how they give to causes important to them through corporate giving programs.
- 93% of nonprofit organizations believe they can increase the amount of money they raise through corporate donations.
- The new auto-send functionality is projected to generate an 80% increase in matching donation revenue for organizations using Double the Donation tools.
Corporate Giving Technology Statistics
- Double the Donation is the largest provider of donation matching tools for nonprofits and educational institutions working with 78% of the largest nonprofits in the United States.
- More than US$50 million has been invested over the past two years in new CSR startups to help expand matching grants, voluntary grants and other corporate giving offerings.
- The three largest legacy CSR providers for corporations are YourCause, CyberGrants, and Benevity, although collectively they support less than 25% of all corporate giving programs.
- Four of the fastest-growing CSR providers are Millie, Point, Selflessly, and Givinga, all of which have integrations with Double the Donation to help increase matching gift usage rates.
- Nonprofits using matching donation software to identify eligible donors result in 77% more donations being flagged as eligible for matching and can double or even triple an organization's matching donation revenue due to better identification and utilization rates higher.
- Nonprofits that use 360MatchPro's automation tools in their fundraising strategy increase their matching gift revenue by more than 61%.
Corporate Donation Blocks
- Only 1.31% of individual donations are matched at the nonprofit average, although more than 10% are eligible for corporate matching.
- 78% dos doadores não sabem se sua empresa oferece um programa de doações equiparadas.
- 16% dos doadores sabem que sua empresa tem um programa, mas não têm certeza se são elegíveis ou não sabem como enviar sua solicitação git correspondente.
- 8% dos doadores sabem que sua empresa tem um programa, sabem que são elegíveis It is sabem como enviar sua solicitação de doação correspondente.
- Only 19% companies include more than one paragraph in their equivalent gift programs in easily accessible employee handbooks or training materials and on their websites.
- 80% das organizações sem fins lucrativos afirmaram ter dificuldade em construir parcerias corporativas fortes e estratégias de doação no local de trabalho com pessoal e recursos limitados.
With all these hurdles, the best way for nonprofits to increase their matching gift revenue is to use the service Double the Donation. Companies should also make sure to use a CSR provider with auto-ship enabled .
Workplace Giving Statistics
- Os programas de doações equivalentes para funcionários são o programa de doações corporativas mais procurado pelos funcionários.
- 67% of the Fortune 500 companies offer matching gift programs, with this number growing each of the last 3 years.
- Nearly 27 million people work for companies that offer matching gift programs.
- Approximately US$5 billion is raised annually through workplace giving, with over 50% of that amount coming from employee matching giving programs.
- An estimated US$ 2 to 3 billion is donated annually through matching grant programs, with US$ 4 to US$ 7 billion unclaimed each year
- Employee corporate donations accounted for 12% of total corporate cash contributions.
Online Giving Trends
Overall online fundraising revenue grew by 23% in 2017.
Estatísticas de doações de caridade online mostram crescimento
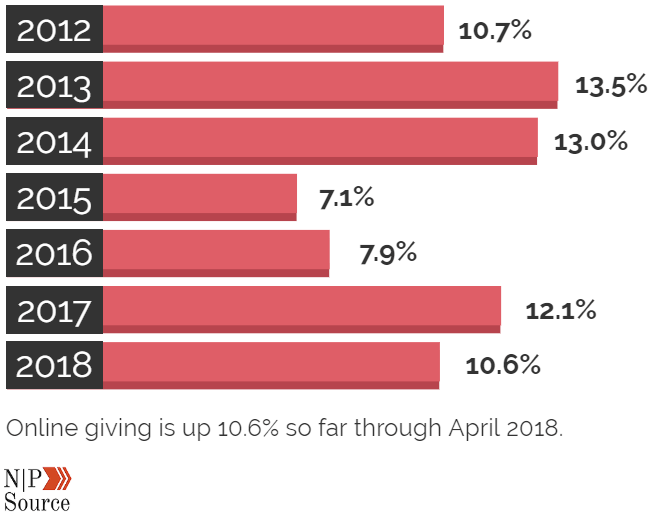
- Online donations grew by 12.1% in 2017.
- Online donations have seen consistent growth year after year:
- 2012: US$ 19.2 billion
- 2013: US$ 21.2 billion
- 2014: US$ 24.1 billion
- 2015: US$ 25.8 billion
- 2016: US$ 27.8 billion
- 2017: US$ 31 billion
- 54% of donors around the world prefer to donate online with a credit or debit card.
- 11% prefer direct mail.
- 11% prefer money.
- 10% prefer bank/wire transfer.
- 9% prefer Paypal.
- 4% prefer mobile app/wallet.
- 1% prefere mensagem de texto.
- $ 128 dólares é o valor médio da doação online.
- $ $326 is the average annual total of donations for recurring donors.
- 67% of non-profit organizations around the world are prepared to accept online donations.
- On December 31st, online donations are concentrated between 12pm and 7pm.
- On December 31st, online donations are concentrated between 12pm and 7pm.
- Páginas de doação com marca personalizada aninhadas no site de uma organização sem fins lucrativos arrecadam 6 vezes mais dinheiro.
Online Fundraising Statistics
- Overall online revenue increased by 23% in 2017, accelerating from the previous year's growth of 15%.
- All monitored sectors saw online revenue growth of at least 15%, with particularly large gains for environmental (34%) and rights (37%) nonprofits.
- Nonprofits received an average of 28% more online gifts in 2017 than in 2016.
- Em média, 38% dos doadores que fizeram uma doação online para uma organização sem fins lucrativos em 2016 fizeram uma doação online novamente para essa organização sem fins lucrativos em 2017.
- A retenção foi de 25% para os doadores que fizeram a sua primeira doação em 2016 e de 60% para os doadores repetidos (que deram pelo menos uma doação antes de 2016 e novamente em 2016).
- Unique gift revenue increased by 19% in 2017.
- Remarketing on Facebook, Google Adsense, Twitter or LinkedIn can increase traffic to your donation pages.
- In one case study, a nonprofit used Facebook Custom Audiences to generate 63% more online donations.
- Revenue from monthly donations grew by 23%, compared to 13% growth from one-time donations.
- Pre-selecting monthly donations on your donation page can increase monthly donation conversions by up to 35%.
- Email messages accounted for 26% of all online revenue.
- Live chat support increases audience engagement rates to generate 45% more opt-in conversions.
- For every 1,000 fundraising messages sent, nonprofits raised US$ 42.
- There were noticeable differences in this metric according to the size of the nonprofits. Small nonprofits (fewer than 100,000 email subscribers) received US$ 71 per 1,000 fundraising emails sent; Medium nonprofits (100,000–500,000 email subscribers) received US$ 36; and large nonprofits (500,000+ subscribers) received US$ 32.
General Online Giving Statistics
- Apenas 3% das instituições de caridade classificam o seu conselho de administração e executive leadership as having digital knowledge .
- 66% das instituições de caridade estão preocupadas em perder oportunidades de arrecadação de fundos digitais.
- Direct mail motivated 36% more donors to donate online in 2016 compared to the previous year.
- 51% of wealthy donors (more than US$ 200 thousand) prefer to donate online.
- 34% of nonprofits paid for social media advertising.
- 21% of donations are made directly via social media.
Digital Ad Statistics for Nonprofits
- Nonprofit spending on digital ads increased by 19% in 2021, with organizations spending about US$ 0.06 for every dollar raised online.
- Search ads (like Google Ads ) have the highest ROI for nonprofits using paid advertising, with an average ROI of US$ 4.78.
- Google processes around 3.7 billion search queries every day and holds over 84% of the desktop search engine market.
- 98% of searchers click on a result on page 1 of Google search results.
- Microsoft search engines (including Bing and Yahoo!) have about 11.5% of the desktop search engine market share.
- O programa Google Ad Grants doou mais de US$ 10 bilhões em publicidade gratuita para sua plataforma de publicidade paga para mais de 115.000 organizações sem fins lucrativos em mais de 50 países.
- For Google Ads, advocacy groups and nonprofits have an average cost per click (CPC) of US$ 1.43.
- View-through revenue (revenue from donors who viewed but did not click on an ad) represents 35% of all donations from digital ads.
- In 2021, return on ad spend (ROAS) was highest for Search ads (US$ 3.72). Display ROAS was US$ 0.59, while social media ROAS was US$ 0.57.
Giving Tuesday 2018 Statistics
The next Giving Tuesday event will be held on December 3, 2018.
- Giving Tuesday raised US$ 380 million dollars online, an increase of 38% or US$ 106 million from 2017.
- 14.2 billion of social media impressions .
- More than 150 countries participated in Giving Tuesday
- Giving Tuesday continues to grow year after year:
- 2012: US$ 10.1 million
- 2013: US$ 28 million
- 2014: US$ 45.7 million
- 2015: US$ 116.7 million
- 2016: US$ 168-US$ 177 million
- 2017: US$ 274 million
- 2019: US$ 380 million
- O Facebook arrecadou mais de US$ 125 milhões para caridade no Giving Tuesday, um aumento de 178% ou US$ 80 milhões em relação a 2017. O
Facebook and PayPal matched US$ 7 million in donations to US nonprofits Giving Tuesday. Up to US$ 20,000 per donor and US$ 250,000 per non-profit organization. - The biggest Giving Tuesday payment processing platforms:
- Facebook : US$ 125 million, up from US$ 45 million (+178%) last year.
- PayPal : US$ 98 million, up from US$ 64 million (+53%) last year.
- Blackbaud : US$ 62.6 million, up from US$ 60.90 million (+2.80%) last year.
- DonorPerfect: US$ 35.20 million processed in 2018.
- Elegant : US$ 15.40 million processed in 2018.
- 46% of donors around the world have never heard of #GivingTuesday.
- The average value of online gifts exceeded US$ 134.00.
- 17% das visualizações de formulários de doação online ocorreram em um dispositivo móvel.
- Religious nonprofits now receive the highest percentage of online donations #GivingTuesday.
- The five main issues discussed: public and social benefit, human services, education, health, environment and animals.
Engagement on Nonprofit Websites
- For every 1,000 website visitors, a non-profit organization raises US$ 612.
- Nonprofits raised US$ 1.13 per website visitor in 2017.
- International non-profits raised the most, US$ 4.11 per visitor, while the rights sector had the lowest revenue per visitor, with US$ 0.31.
- No geral, 1,1% dos visitantes do site fizeram uma doação, um aumento de 18% em relação a 2016.
- Website traffic decreased slightly in 2017, with 1.4% fewer visitors per month.
- Half of nonprofit website traffic came from cellphone and tablet users.
- Mobile devices accounted for 40% of all visitors, tablets accounted for 10%, and desktop users accounted for the other 50%.
- The share of mobile traffic increased by 9% compared to 2016, while the share of visitors using desktop or laptop computers decreased by 4%.
- Nonprofit homepages took an average of 3,181 seconds to load, while donation pages took 2,816 seconds to load.
Monthly Donation Statistics
- 45% dos doadores inscreveram-se num programa de doações mensais.
- A doação online monthly average is US$ 52 (US$ 624 per year), compared to the one-time donation average of US$ 128.
- Monthly donation income increased by 40% in 2017.
- Monthly donations represented 14% of all online revenue in 2016 and 16% of online revenue in 2017.
- Donors who make recurring donations give 42% more annually compared to one-time donations.
- 52% dos Millennials são mais propensos a doar mensalmente do que uma grande doação única.
Online Crowdfunding Statistics
- 41% have donated to crowdfunding campaigns that benefit individuals.
- 16% dos crowdfunders doam menos dinheiro para NGS, NPOs e instituições de caridade devido ao seu apoio financeiro a campanhas de crowdfunding.
- 14% of donors around the world created an online peer-to-peer fundraising campaign.
- US$ 9,237.55 is the average amount a non-profit crowdfunding campaign raises.
- US$ 568 is the average amount individuals raise through crowdfunding.
- On average, 8 people donate to an individual crowdfunding campaign.
- O tamanho médio da doação para uma campanha de crowdfunding é de US$ 66.
- 17% of crowdfunding donations are made on mobile devices.
- Campaigns that manage to reach 30% of their goal in the first week are more likely to be successful.
- Social media is a critical factor in crowdfunding success: for every order of magnitude increase in the number of Facebook friends (10, 100, 1,000), the probability of success increases dramatically (from 9% to 20% to 40%).
- Individuals between the ages of 24 and 35 are much more likely to participate in crowdfunding campaigns; those over 45 are significantly less likely to support campaigns.
- There is an average increase of 35% in donations when there is a crowdfunding thermometer.
- 62% of donors who donate to crowdfunding campaigns are new to crowdfunding.
- 300-500; the average word count in the campaign description for projects that raise the most money.
- Campaign owners raise 3x more if they update supporters every 5 days.
- The average number of updates a successful campaign owner posts is 4.
- Crowdfunding campaigns get 126% more donations when owners update backers.
- Campaigns shared less than 2 times have a 97% chance of failure.
- Crowdfunding campaigns with personal videos raise 150% than those without videos.
- Mais da metade das pessoas que recebem um e-mail sobre uma campanha de crowdfunding fizeram uma doação.